What is an oil and gas decline curve? An oil and gas decline curve can be described as: “A graph that represents the amount of oil and gas produced or estimated to be produced in the future over the life of a well”
What does an oil and gas decline curve look like?
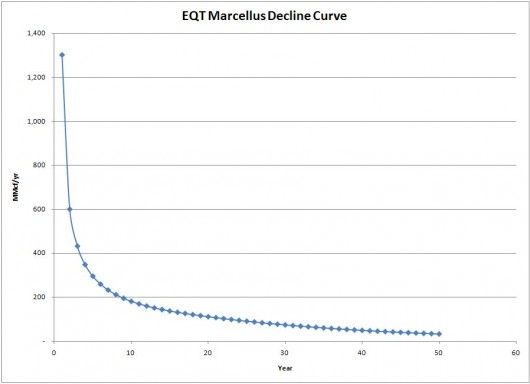
The graph above shows you what a typical Marcellus Shale Well decline curve looks like. Every well is going to be a little different, but generally speaking the decline curve above shows you what the production of a well will do. You can see from the graph that in the beginning, the amount of oil and gas produced from the well is extremely high. Then as time passes it quickly declines over the first 3 to 5 years until it eventually levels off at a much lower amount of production. Once the “initial decline period” is over, it will then slowly decrease over the life of the well.
Marcellus Decline Curve
The graph above shows you what a typical Marcellus Shale Well decline curve looks like. Every well is going to be a little different, but generally speaking the decline curve above shows you what the production of a well will do. You can see from the graph that in the beginning, the amount of oil and gas produced from the well is extremely high. Then as time passes it quickly declines over the first 3 to 5 years until it eventually levels off at a much lower amount of production. Once the “initial decline period” is over, it will then slowly decrease over the life of the well.
The Initial Decline Period
The initial decline period is the first 3 to 5 years where the production starts out very high but quickly decreases. Production starts out very high because the frack process and pressure that’s been built up causes significant initial production. The well produces a huge amount of oil and gas when it first starts producing. Over time, this pressure decreases until the wells natural pressure causes it to produce at a more standard rate over a long period of time.
Many mineral owners make the mistake of thinking their royalties are going to be substantially more than they are because they base the value on the first few years of production. The true value of oil and gas royalties is based on what the well will produce over the course of it’s entire life. The initial production is not a good measure of the overall value so you have to evaluate a well based on the total amount left to be produced.
How is a decline Curve Made?
When a mineral rights buyer comes up with a decline curve, they will use the existing information about production, and then use a computer to model the rest of the expected decline curve. The computer model comes from what other wells in the area are producing. Based on the production of your well, what a well typically does, and what wells immediately surrounding your well are doing, a decline curve can be created to model out the production for many years to help estimate how much production there will be.
Free Consultation
If you own mineral rights and have questions, fill out the free consultation form below. We can help you with the following questions:
- Mineral Rights Value
- Evaluate whether you have a fair offer to sell mineral rights
- Answer questions about selling mineral rights
- Understanding Market Value of Mineral Rights
- + Any other questions related to mineral rights!
No matter what question you have regarding your mineral rights, we can help! We usually respond to your inquiry within 1 to 2 hours!
Whether you want to sell mineral rights, determine mineral rights value, or simply have some basic questions regarding your mineral rights ownership, fill out the form and we will quickly be in touch.


